Independent Texas crash-data analysis
2026 Texas DWI Crash Data Report
Analysis of TxDOT’s latest available 2025 DUI (Alcohol) crash data
Texas recorded 22,194 crashes in TxDOT’s “DUI (Alcohol)” dataset during 2025. Those crashes killed 906 people and caused 2,133 suspected serious injuries. This report translates the official tables into statewide, county and time-of-week findings for victims, families, reporters and safety researchers.
Terminology note: this site uses the familiar Texas term “DWI.” TxDOT labels the underlying statistical category “DUI (Alcohol).” We retain TxDOT’s label when describing the dataset and do not broaden it to drug-involved crashes.
About this research
- Primary source
- Texas Department of Transportation (TxDOT)
- Dataset
- 2025 DUI (Alcohol) crash statistics
- Coverage
- Texas statewide · county, city, day-of-week and hour-of-day tables
- Analysis
- Texas Settlement Calculator Research Team
Definition note: TxDOT labels the underlying category “DUI (Alcohol).” TSC uses “DWI” in the report title as familiar Texas consumer terminology; these figures are not a combined drug-and-alcohol dataset.
Jump to methodology and source tables22,194
alcohol-involved crashes
Texas, 2025
906
people killed
in 809 fatal crashes
2,133
suspected serious injuries
in 1,547 serious-injury crashes
2:00 a.m.
highest-volume hour
2,441 crashes from 2:00–2:59 a.m.
Source: TxDOT 2025 DUI (Alcohol) crash tables. Counts are crashes, fatalities or injuries as labeled—not estimates of unique claims.
Source status
TxDOT source archive rechecked October 1, 2026
TxDOT's 2025 Crash Statistics archive was rechecked and continues to list the 2025 DUI (Alcohol) statewide, county, city, hour-of-day, and day-of-week source tables used in this report.
Texas Settlement Calculator uses TxDOT's DUI (Alcohol) category exactly as published for the underlying statistics. The report title uses DWI as familiar Texas consumer terminology.
View TxDOT 2025 crash statistics archiveQuick-reference facts
Citable Texas DWI crash findings
These statements summarize TxDOT's published DUI (Alcohol) tables and identify calculations performed by Texas Settlement Calculator.
- Texas recorded 22,194 crashes in TxDOT's DUI (Alcohol) dataset during 2025.
- Those crashes included 809 fatal crashes and 906 fatalities.
- TxDOT reported 1,547 suspected serious-injury crashes and 2,133 suspected serious injuries in the 2025 DUI (Alcohol) dataset.
- Texas recorded 147 fewer alcohol-involved fatalities in 2025 than in 2024, a decline of about 14.0% (Texas Settlement Calculator analysis of TxDOT data).
- Harris County recorded 3,090 alcohol-involved crashes in 2025, the highest raw county total in the TxDOT county table.
- The 2:00–2:59 a.m. hour recorded 2,441 alcohol-involved crashes statewide in 2025, the highest total of any hour in the TxDOT hourly table.
Cite this report
Journalists, researchers and public-resource pages may cite this publication. Please credit Texas Settlement Calculator, link to the canonical URL below, and attribute any underlying government data to its own source.
- Title
- 2026 Texas DWI Crash Data Report
- Publisher
- Texas Settlement Calculator
- Published
- September 7, 2026
- Last reviewed
- October 1, 2026
- Canonical URL
- https://texassettlementcalculator.com/research/texas-dwi-crash-statistics
- Underlying source
- Texas Department of Transportation, 2025 DUI (Alcohol) crash statistics (statewide, county, city and hour/day tables; records processed as of April 7, 2026), with 2024 comparisons from the prior-year TxDOT reports.
Suggested citation: Texas Settlement Calculator, “2026 Texas DWI Crash Data Report,” https://texassettlementcalculator.com/research/texas-dwi-crash-statistics (Published September 7, 2026; Last reviewed October 1, 2026). Underlying data: Texas Department of Transportation, 2025 DUI (Alcohol) crash statistics (statewide, county, city and hour/day tables; records processed as of April 7, 2026), with 2024 comparisons from the prior-year TxDOT reports.
Executive summary
2026 Report — Key Findings
Scope: Texas statewide, from TxDOT’s 2025 DUI (Alcohol) statewide, county, city and hour/day tables (records processed as of April 7, 2026), compared with the prior-year TxDOT reports for 2024. Figures labeled TxDOT are published values; percentages and county shares are Texas Settlement Calculator calculations of those tables.
- The toll remained severe: TxDOT reported 906 people killed and 2,133 suspected serious injuries in 2025 alcohol-involved crashes (published TxDOT statewide totals).
- Fatalities improved year over year: 2025’s 906 alcohol-involved fatalities were 147 fewer than the 1,053 reported for 2024 — a decline of about 14.0% (Texas Settlement Calculator calculation of TxDOT 2024 and 2025 totals).
- Harris County led the state: 3,090 alcohol-involved crashes in 2025, about 13.9% of the statewide total (TxDOT county count; share calculated by Texas Settlement Calculator).
- Weekends dominated: Saturday recorded 5,390 crashes and Sunday 5,242 — together about 47.9% of the statewide 2025 total (TxDOT day-of-week counts; share calculated by Texas Settlement Calculator).
- The 2 a.m. hour stood out: 2:00–2:59 a.m. produced 2,441 crashes and 108 fatal crashes, the highest totals of any hour in the 2025 TxDOT hourly table.
Limitations: raw county and city totals are not adjusted for population, traffic volume or miles traveled, so they are not relative-risk rankings. “Suspected serious injury” is the severity label used in the source tables. TxDOT crash data are administrative records and may be revised. Day-of-week and hour-of-day totals are separate views of the same dataset and must not be added together. Counts describe reported crashes and people; they do not establish fault, causation, insurance coverage or claim value.
Year-over-year comparison
Texas alcohol-involved crashes, 2024–2025
Texas recorded fewer alcohol-involved crashes, fatalities, and suspected serious injuries in 2025 than in 2024. The table uses the same TxDOT DUI (Alcohol) measures in both annual county reports.
| Measure | 2024 | 2025 | Change | Percent |
|---|---|---|---|---|
| Alcohol-involved crashes | 22,737 | 22,194 | -543 | -2.4% |
| Fatalities | 1,053 | 906 | -147 | -14.0% |
| Suspected serious injuries | 2,245 | 2,133 | -112 | -5.0% |
Texas Settlement Calculator calculations from the cited TxDOT 2024 and 2025 DUI (Alcohol) county reports. Percentages are rounded to one decimal place. One year-over-year change does not establish a long-term trend or causation.
Texas counties with the most alcohol-involved crashes
The ranking below uses total crashes in TxDOT’s county table. Fatal-crash, fatality and suspected-serious-injury columns are shown separately because a single crash can involve multiple people.
| Rank / county | Total crashes | Fatal crashes | Fatalities | Serious crashes | Serious injuries |
|---|---|---|---|---|---|
| 1. Harris | 3,090 | 126 | 138 | 163 | 224 |
| 2. Dallas | 1,986 | 71 | 79 | 122 | 174 |
| 3. Bexar | 1,621 | 44 | 46 | 67 | 99 |
| 4. Tarrant | 1,449 | 31 | 31 | 91 | 122 |
| 5. Travis | 1,140 | 33 | 34 | 30 | 38 |
| 6. Hidalgo | 675 | 15 | 16 | 42 | 68 |
| 7. El Paso | 648 | 21 | 22 | 35 | 44 |
| 8. Collin | 629 | 20 | 25 | 31 | 39 |
| 9. Denton | 553 | 10 | 10 | 28 | 33 |
| 10. Montgomery | 426 | 13 | 14 | 27 | 46 |
County change analysis
How the highest-count counties changed
This fixed comparison follows the ten counties with the highest raw alcohol-involved crash counts in 2025 and shows each county's corresponding 2024 total. It is not a ranking of the largest increases statewide.
| 2025 rank / county | 2024 | 2025 | Change | Percent |
|---|---|---|---|---|
| 1. Harris | 3,357 | 3,090 | -267 | -8.0% |
| 2. Dallas | 1,945 | 1,986 | +41 | +2.1% |
| 3. Bexar | 1,654 | 1,621 | -33 | -2.0% |
| 4. Tarrant | 1,425 | 1,449 | +24 | +1.7% |
| 5. Travis | 1,182 | 1,140 | -42 | -3.6% |
| 6. Hidalgo | 752 | 675 | -77 | -10.2% |
| 7. El Paso | 625 | 648 | +23 | +3.7% |
| 8. Collin | 611 | 629 | +18 | +2.9% |
| 9. Denton | 566 | 553 | -13 | -2.3% |
| 10. Montgomery | 485 | 426 | -59 | -12.2% |
Harris County recorded 267 fewer alcohol-involved crashes than in 2024, while remaining the highest-count county in 2025.
Dallas County recorded 41 more crashes, but fatalities declined from 102 to 79. Tarrant County recorded 24 more crashes, while suspected serious injuries increased from 104 to 122.
Travis County recorded 42 fewer crashes and suspected serious injuries declined from 83 to 38. These changes describe reported counts; they do not identify a cause.
Raw county totals are not adjusted for population, driving exposure, vehicle miles traveled, or alcohol consumption. They should not be interpreted as relative-risk or “most dangerous county” rankings and do not establish fault in any collision.
Selected city ranking
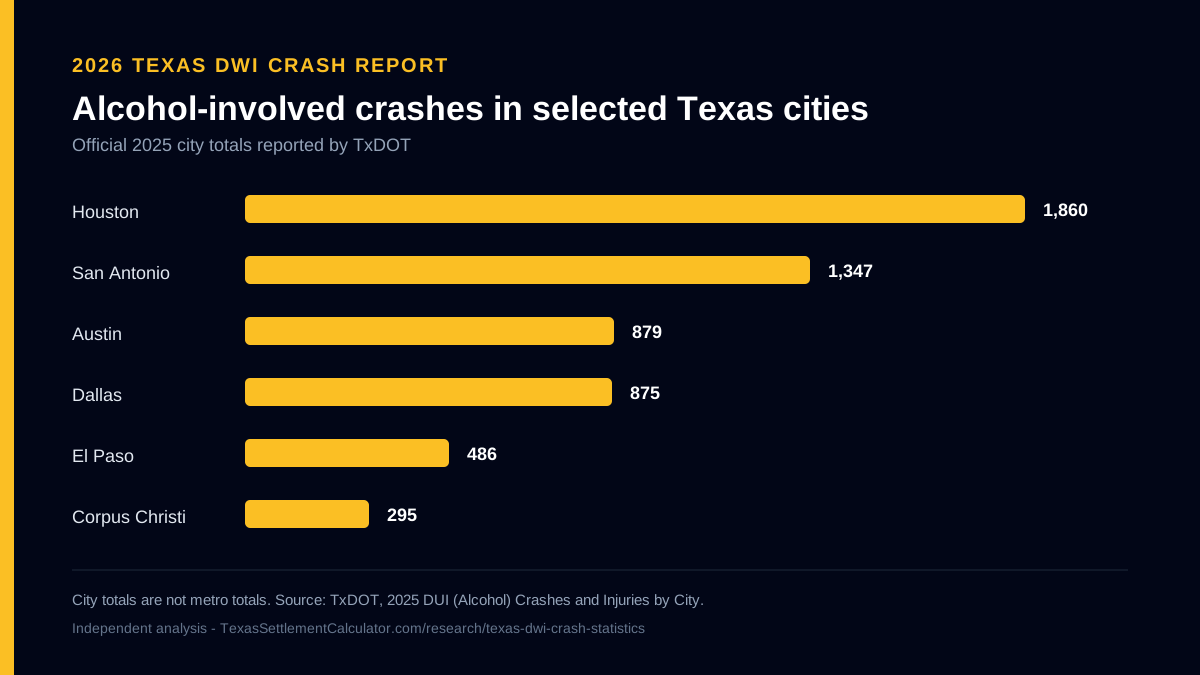
Alcohol-involved crashes in major Texas cities
These are official city totals from TxDOT, ranked among the selected cities shown. They are not metropolitan-area totals and should not be added to county figures.
| Rank / city | Crashes | Fatal crashes | Fatalities | Serious injuries |
|---|---|---|---|---|
| 1. Houston | 1,860 | 75 | 86 | 125 |
| 2. San Antonio | 1,347 | 38 | 40 | 75 |
| 3. Austin | 879 | 23 | 23 | 23 |
| 4. Dallas | 875 | 40 | 42 | 94 |
| 5. El Paso | 486 | 16 | 17 | 28 |
| 6. Corpus Christi | 295 | 8 | 9 | 22 |
| 7. Amarillo | 246 | 4 | 4 | 33 |
| 8. Lubbock | 241 | 3 | 4 | 15 |
| 9. Odessa | 194 | 5 | 5 | 9 |
| 10. Brownsville | 141 | 1 | 1 | 16 |
| 11. McAllen | 137 | 4 | 4 | 20 |
| 12. Midland | 134 | 5 | 5 | 12 |
| 13. Laredo | 126 | 0 | 0 | 2 |
Selected-county analysis
Texas market groupings
We calculated these totals by adding the listed TxDOT county totals. The boundaries are editorial groupings used for consistent market analysis; they are not official TxDOT metro definitions.
| Market | Counties included | Calculated crashes |
|---|---|---|
| Dallas-Fort Worth | Dallas, Tarrant, Collin, Denton | 4,617 |
| Houston area | Harris, Montgomery, Fort Bend | 3,809 |
| San Antonio area | Bexar, Comal, Guadalupe | 1,912 |
| Austin corridor | Travis, Williamson, Hays | 1,756 |
| Rio Grande Valley | Hidalgo, Cameron | 1,066 |
| El Paso | El Paso | 648 |
| Corpus Christi | Nueces | 350 |
| Permian Basin | Ector, Midland | 514 |
| Amarillo area | Potter, Randall | 318 |
| Lubbock | Lubbock | 302 |
| Laredo | Webb | 134 |
When Texas alcohol-involved crashes happen
Saturday
5,390 total crashes · 214 fatal crashes
Sunday
5,242 total crashes · 194 fatal crashes
Friday
3,462 total crashes · 118 fatal crashes
2:00–2:59 a.m.
2,441 total crashes · 108 fatal crashes
12:00–12:59 a.m.
1,875 total crashes · 55 fatal crashes
11:00–11:59 p.m.
1,853 total crashes · 71 fatal crashes
Day totals and hourly totals are separate views of the same statewide dataset and should not be added together.
What the numbers mean for an injured person
A statistical classification does not prove fault or determine claim value. A civil case turns on evidence about the driver, causation, injuries, insurance and any additional responsible party. Police body-camera footage, blood or breath testing, dispatch records, receipts and witness information can disappear under different retention schedules, so preservation should begin promptly.
Evidence checklist
- Police crash report and case number
- Blood or breath test records
- Body-camera and dash-camera video
- 911 audio and dispatch logs
- Photos, vehicle data and witness contacts
- Bar receipts and surveillance, when relevant
- Medical records and bills
- Insurance declarations and UM/UIM coverage
Texas legal and victim resources
Exemplary damages: Texas Civil Practice and Remedies Code §41.003 requires clear and convincing evidence of fraud, malice or gross negligence. Intoxication does not make an award automatic.
Dram-shop claims: Texas Alcoholic Beverage Code §2.02 creates a potential claim against a provider only when the statute’s specific conditions are satisfied. It is not available in every DWI crash.
Crime Victims’ Compensation: eligible victims may seek help with certain crime-related costs through the Texas Attorney General’s program; compensation is not guaranteed.
Methodology and limitations
How this report was prepared
We transcribed published totals from TxDOT’s 2024 and 2025 DUI (Alcohol) county reports and the 2025 statewide comparison, city, and hour/day tables. The 2024 report reflects records processed as of April 9, 2025; the 2025 report reflects records processed as of April 7, 2026. County and selected-city rankings use total crashes. Selected-county market totals are calculated sums of the counties expressly listed; they are not official TxDOT metro definitions.
For every year-over-year row, absolute change equals the 2025 value minus the 2024 value. Percentage change equals that difference divided by the 2024 value, multiplied by 100 and rounded to one decimal place. The county comparison uses a fixed cohort: the ten counties with the highest 2025 crash totals and their corresponding 2024 values.
TxDOT crash data is administrative data and may be revised. “Suspected serious injury” is the severity label used in the source tables. Counts describe reported crashes and people; they do not establish civil liability, insurance coverage, compensation eligibility or settlement value. We did not combine DUI (Alcohol) measures with TxDOT’s broader drug-or-alcohol statistics.
Independent-publication disclosure: This independent report is not affiliated with, sponsored by, approved by, or endorsed by the Texas Department of Transportation or any other Texas governmental agency. TxDOT is identified solely as the source of the underlying public data.
Download and cite
Publication files and embeddable chart
Download report data
Statewide, county, city and calculated-market data.
Download chart
High-resolution, scalable SVG graphic.
Embed with attribution
Newsrooms, educators and safety organizations may embed this chart unchanged with the source link retained.
Editorial transparency
Research, corrections and press use
Research standard
Every published figure is transcribed from a cited TxDOT table or clearly labeled as a calculation. City, county and selected-county figures remain separate to avoid false comparisons.
Corrections
To report a possible data or transcription error, email privacy@texassettlementcalculator.com. Substantiated corrections will be documented with a revised review date.
Ready-to-cite findings
Texas recorded 22,194 alcohol-involved crashes in 2025 - 543 fewer than in 2024, a decline of approximately 2.4%.
Alcohol-involved crash fatalities declined from 1,053 in 2024 to 906 in 2025, while suspected serious injuries declined from 2,245 to 2,133.
Harris County accounted for approximately 13.9% of Texas alcohol-involved crashes in 2025.
Among the ten highest-count 2025 counties, Dallas, Tarrant, El Paso, and Collin recorded more alcohol-involved crashes than in 2024.
Saturday and Sunday together accounted for approximately 47.9% of the statewide total.
Houston recorded 1,860 alcohol-involved crashes in 2025, the highest total among the selected Texas cities analyzed.
Press and data inquiries: contact@texassettlementcalculator.com. Please cite the report title and link to the live publication.
Texas research network
Explore statewide and regional crash-data research
The Research Center organizes TSC’s statewide DWI and commercial-vehicle reports, regional briefs, corridor research and public-data methodology in one place.
Open the Research CenterBrowse the publications and downloads directory for every TSC report, regional study, kit, checklist and research data file.
Continue researching your Texas DWI case
Were you injured by an impaired driver?
Get a private preliminary range in about two minutes. No sign-up is required.
Start the DWI calculatorSources
- TxDOT crash data and crash records (CRIS)
State crash data and the crash-report / records request process relied on by these pages.
This tool produces a preliminary, non-binding estimate based on the information you provide and general personal-injury valuation methods. It is not legal advice, not a guarantee of any outcome, and not a substitute for review by a licensed attorney. Actual settlements and verdicts vary widely based on evidence, jurisdiction, insurance coverage, and many other factors. Texas Settlement Calculator is not a law firm and does not practice law; use of this tool does not create an attorney-client relationship.