2026 Texas 18-Wheeler Crash Data Report — Analysis of the Latest Available 2025 Texas Crash Data
2026 Texas 18-Wheeler Crash Data Report
2025 Texas Commercial Truck Accident Statistics, County Rankings & Five-Year Trends
Texas recorded 38,533 crashes involving commercial motor vehicles in 2025, according to the Texas Department of Transportation. Those crashes included 469 fatal crashes, 528 fatalities, and 1,267 crashes involving suspected serious injuries. This report analyzes the latest completed statewide TxDOT commercial-motor-vehicle data available in 2026. It is intended as a public research and educational resource.
About this research
- Primary source
- Texas Department of Transportation (TxDOT)
- Dataset
- 2025 CMV-Involved Crashes and Injuries by County
- Coverage
- Texas statewide · 2025 data with 2021–2025 trend comparisons
- Analysis
- Texas Settlement Calculator Research Team
Definition note: TxDOT's CMV category includes commercial motor vehicles beyond tractor-trailers. “18-wheeler” is used in consumer-facing report language; the statistics are not limited to tractor-trailers.
Jump to sources and methodologyFree preliminary estimate. No obligation.
38,533
Commercial Motor Vehicle Crashes
528
Fatalities
1,267
Suspected Serious-Injury Crashes
1,611
Suspected Serious Injuries
Texas — Calendar Year 2025
Source: Texas Department of Transportation
TxDOT reports that the 2025 CMV county statistics reflect reportable Texas Peace Officer crash reports received and processed by the Department as of April 7, 2026. The 2021–2024 trend figures in this report reflect TxDOT processing as of April 9, 2025.
Source status
Government sources rechecked October 1, 2026
TxDOT 2025 annual CMV county report verified against the agency source. The report states that records were received and processed through April 7, 2026.
FMCSA A&I was also checked as supplemental federal context. Its Crash Query Tool showed an MCMIS snapshot date of August 28, 2026 and continued to state that calendar-year 2025 crash data were still being reported and were provisional.
TxDOT and FMCSA use different datasets and reporting rules. This report uses TxDOT for the primary Texas annual figures and does not combine the two sources into one total.
Quick-reference facts
Citable Texas CMV findings
These statements summarize the primary TxDOT data and clearly identify calculations performed by Texas Settlement Calculator.
- Texas recorded 38,533 CMV-involved crashes in 2025, according to TxDOT.
- Those crashes included 469 fatal crashes and 528 fatalities.
- TxDOT reported 1,267 suspected serious-injury crashes and 1,611 suspected serious injuries involving CMVs in 2025.
- Texas recorded 860 fewer CMV-involved crashes in 2025 than in 2024, a decrease of approximately 2.2% (Texas Settlement Calculator analysis of TxDOT data).
- CMV-crash fatalities declined from 608 in 2024 to 528 in 2025, a decrease of approximately 13.2% (Texas Settlement Calculator analysis of TxDOT data).
- Harris County recorded 5,913 CMV-involved crashes in 2025, the highest raw county total in the TxDOT table.
Raw county totals are not exposure-adjusted risk rates. See Sources and Methodology for definitions, calculation methods, and limitations.
2026 Report — Key Findings
- •Texas recorded 38,533 CMV-involved crashes in 2025.
- •528 people were killed in CMV-involved crashes in 2025, approximately 13.2% fewer than the 608 recorded in 2024 (Texas Settlement Calculator analysis of TxDOT 2024 and 2025 data).
- •Over the five years from 2021 to 2025, fatalities declined from 706 to 528 — approximately 25.2% lower (Texas Settlement Calculator analysis of TxDOT 2021 and 2025 data).
- •Suspected serious-injury crashes remained nearly unchanged: 1,267 in 2025 compared with 1,261 in 2024.
- •Harris County recorded 5,913 CMV-involved crashes in 2025, the highest raw county crash total in Texas.
- •The four counties with the most reported CMV crashes — Harris, Dallas, Bexar, and Tarrant — together accounted for approximately 37.5% of the statewide total (Texas Settlement Calculator analysis of TxDOT 2025 county and statewide data). This is a concentration of raw crash counts, not a measure of relative danger or risk.
County rankings are based on raw TxDOT CMV crash counts. They are not population-, traffic-, or vehicle-miles-traveled-adjusted crash rates and should not be interpreted as rankings of the "most dangerous" Texas counties.
If you were involved in one of these crashes, review the seven steps to take after a Texas 18-wheeler accident, including how to identify the carrier and preserve electronic evidence.
2025 Compared with 2024
The 2026 report analyzes calendar-year 2025 data. Changes below compare the latest completed TxDOT year with calendar-year 2024.
| Measure | 2024 | 2025 | Change | Percent |
|---|---|---|---|---|
| Total CMV crashes | 39,393 | 38,533 | -860 | -2.2% |
| Fatal crashes | 546 | 469 | -77 | -14.1% |
| Fatalities | 608 | 528 | -80 | -13.2% |
| Suspected serious-injury crashes | 1,261 | 1,267 | +6 | +0.5% |
| Suspected serious injuries | 1,601 | 1,611 | +10 | +0.6% |
Percentages are Texas Settlement Calculator calculations from cited TxDOT annual totals, rounded to one decimal place. Changes do not establish causation.
Texas Commercial Truck Accident Statistics: Executive Summary
Texas reported 38,533 commercial-motor-vehicle-involved crashes during 2025.
- 469fatal crashes
- 528fatalities
- 1,267suspected serious-injury crashes
- 1,611suspected serious injuries
- 4,522suspected minor-injury crashes
- 6,576suspected minor injuries
- 4,339possible-injury crashes
- 7,056possible injuries
- 27,587non-injury crashes
- 349crashes categorized as unknown severity
The term "commercial motor vehicle" is the TxDOT dataset category and can include commercial vehicles other than tractor-trailers. We use "18-wheeler" in consumer-facing language, but the statistics above reflect all CMV-involved crashes reported by TxDOT, not exclusively 18-wheeler crashes.
Texas CMV Crash Trend (2021–2025)
| Year | Total CMV Crashes | Fatal Crashes | Fatalities | Serious-Injury Crashes | Serious Injuries |
|---|---|---|---|---|---|
| 2021 | 38,176 | 631 | 706 | 1,334 | 1,708 |
| 2022 | 38,658 | 603 | 706 | 1,294 | 1,645 |
| 2023 | 38,928 | 549 | 621 | 1,351 | 1,687 |
| 2024 | 39,393 | 546 | 608 | 1,261 | 1,601 |
| 2025 | 38,533 | 469 | 528 | 1,267 | 1,611 |
Chart: Total Texas commercial-motor-vehicle crashes by year. 2023: 38,928. 2024: 39,393. 2025: 38,533. Source: TxDOT.
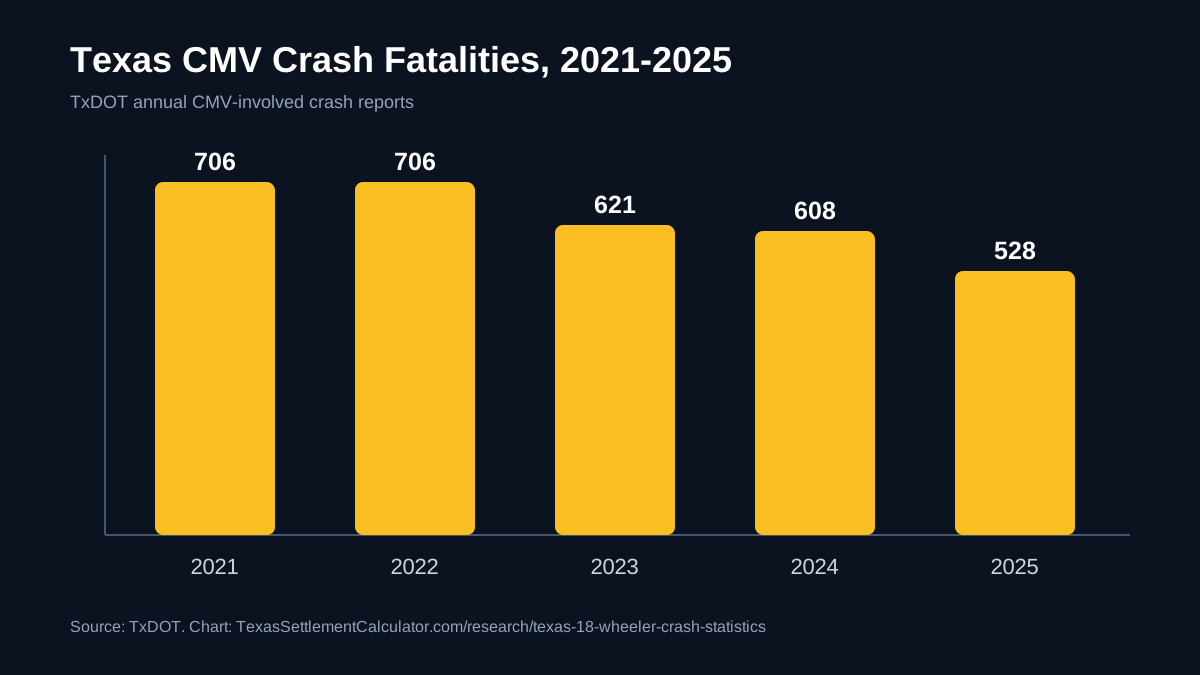
Texas CMV Fatalities, 2021–2025
Chart: Fatalities in Texas commercial-motor-vehicle crashes by year. 2021: 706. 2022: 706. 2023: 621. 2024: 608. 2025: 528. Source: TxDOT. The five-year decline from 706 to 528 fatalities is a Texas Settlement Calculator comparison of TxDOT 2021 and 2025 data.
Texas recorded approximately 2.2% fewer CMV crashes in 2025 than in 2024, and fatalities decreased approximately 13.2%, from 608 to 528 (Texas Settlement Calculator analysis of TxDOT 2024 and 2025 data). Suspected serious-injury crashes remained nearly unchanged, increasing from 1,261 to 1,267.
Over the five years from 2021 to 2025, fatalities in CMV-involved crashes declined from 706 to 528 — approximately 25% lower (Texas Settlement Calculator analysis of TxDOT 2021 and 2025 data). Total CMV crashes were essentially flat across the period, ranging from 38,176 in 2021 to 38,533 in 2025, with a peak of 39,393 in 2024.
Five years of data do not establish a long-term causal trend. Changes can reflect traffic volume, reporting, enforcement, roadway conditions and other factors.
Where Did Texas Record the Most Commercial Vehicle Crashes?
Harris County recorded substantially more CMV-involved crashes than any other Texas county in 2025, followed by Dallas, Bexar and Tarrant counties.
These are the counties with the most reported CMV crashes. Crash count alone is not a danger rate — it does not account for vehicle miles traveled, population, or exposure data. We do not describe these as "the most dangerous counties" because no rate-based analysis has been performed.
| Rank | County | 2025 CMV Crashes |
|---|---|---|
| 1 | Harris | 5,913 |
| 2 | Dallas | 3,778 |
| 3 | Bexar | 2,581 |
| 4 | Tarrant | 2,183 |
| 5 | El Paso | 1,014 |
| 6 | Denton | 948 |
| 7 | Webb | 746 |
| 8 | Collin | 684 |
| 9 | Montgomery | 674 |
| 10 | Travis | 648 |
Top 10 Texas Counties by 2025 CMV Crashes
Chart: Top 10 Texas counties by 2025 CMV-involved crash count. Harris: 5,913. Dallas: 3,778. Bexar: 2,581. Tarrant: 2,183. El Paso: 1,014. Denton: 948. Webb: 746. Collin: 684. Montgomery: 674. Travis: 648. Source: TxDOT. These are raw crash counts, not a population-, traffic-, or vehicle-miles-traveled-adjusted danger ranking.
How Did the Highest-Count Counties Change?
This comparison follows the ten counties with the highest raw CMV crash counts in 2025 and shows each county's corresponding 2024 total. It is a fixed 2025 top-ten comparison—not a ranking of the largest percentage increases statewide.
| 2025 Rank | County | 2024 | 2025 | Change | Percent |
|---|---|---|---|---|---|
| 1 | Harris | 6,313 | 5,913 | -400 | -6.3% |
| 2 | Dallas | 3,857 | 3,778 | -79 | -2.0% |
| 3 | Bexar | 2,684 | 2,581 | -103 | -3.8% |
| 4 | Tarrant | 1,716 | 2,183 | +467 | +27.2% |
| 5 | El Paso | 965 | 1,014 | +49 | +5.1% |
| 6 | Denton | 905 | 948 | +43 | +4.8% |
| 7 | Webb | 885 | 746 | -139 | -15.7% |
| 8 | Collin | 694 | 684 | -10 | -1.4% |
| 9 | Montgomery | 671 | 674 | +3 | +0.4% |
| 10 | Travis | 646 | 648 | +2 | +0.3% |
Among the ten highest-count counties in 2025, Tarrant County recorded the largest year-over-year increase: 467 additional CMV-involved crashes, up approximately 27.2% from 2024.
Harris County recorded 400 fewer CMV-involved crashes in 2025 than in 2024, a decline of approximately 6.3%, while remaining the county with the highest raw total.
Dallas County recorded 79 fewer CMV-involved crashes, but its CMV-crash fatalities increased from 29 in 2024 to 37 in 2025 and suspected serious injuries increased from 124 to 130.
Texas Settlement Calculator calculations from the cited TxDOT 2024 and 2025 CMV county reports. Percentages are rounded to one decimal place. These raw counts are not adjusted for population, commercial traffic, vehicle miles traveled, or roadway exposure; they do not establish relative risk, fault, or causation.
Selected Texas Market-Area Ranking
This table sums only the named counties available in this report dataset. It is not a complete metropolitan statistical area total or an exposure-adjusted danger ranking.
| Rank | Market | Counties included | Crashes |
|---|---|---|---|
| 1 | Dallas-Fort Worth | Dallas, Tarrant, Denton, Collin | 7,593 |
| 2 | Houston area | Harris, Montgomery, Fort Bend | 7,076 |
| 3 | San Antonio anchor | Bexar | 2,581 |
| 4 | Austin area | Travis, Williamson | 1,162 |
| 5 | El Paso | El Paso | 1,014 |
County-by-County CMV Crash Data
All county figures on this page come from the TxDOT 2025 Commercial Motor Vehicle (CMV) Involved Crashes and Injuries by County report linked in the Sources and Methodology section below. County values are raw crash counts reported by TxDOT.
Houston Area: Harris County
Harris County recorded the largest raw count of CMV crashes in Texas in 2025. The county encompasses Houston and surrounding communities, with major freight corridors including I-10, I-45, I-69/US-59, and the I-610 Loop.
5,913
Total crashes
41
Fatal crashes
43
Fatalities
108
Serious-injury crashes
125
Serious injuries
Dallas / Dallas County
Dallas County recorded the second-highest number of CMV crashes in Texas. The county includes Dallas and surrounding cities, with heavy freight traffic on I-35E, I-30, I-345, and the I-20 warehouse belt.
3,778
Total crashes
33
Fatal crashes
37
Fatalities
101
Serious-injury crashes
130
Serious injuries
San Antonio / Bexar County
Bexar County includes San Antonio and sits along the I-35 and I-10 corridors, which carry heavy cross-border and long-haul freight traffic.
2,581
Total crashes
12
Fatal crashes
16
Fatalities
32
Serious-injury crashes
37
Serious injuries
Fort Worth / Tarrant County
Tarrant County includes Fort Worth and the western half of the Dallas–Fort Worth Metroplex. I-35W, I-20, and I-820 carry substantial commercial freight through the county.
2,183
Total crashes
15
Fatal crashes
16
Fatalities
63
Serious-injury crashes
71
Serious injuries
Austin / Travis County
Travis County includes Austin and sits on the I-35 corridor, which carries significant through-freight between San Antonio and the Dallas–Fort Worth Metroplex.
648
Total crashes
7
Fatal crashes
11
Fatalities
22
Serious-injury crashes
30
Serious injuries
El Paso / El Paso County
El Paso County sits at the western edge of Texas along I-10, a major transcontinental freight corridor, and handles significant cross-border commercial traffic.
1,014
Total crashes
7
Fatal crashes
7
Fatalities
14
Serious-injury crashes
15
Serious injuries
Additional Texas County CMV Crash Data
| County | 2025 CMV Crashes |
|---|---|
| Hidalgo | 597 |
| Midland | 536 |
| Williamson | 514 |
| Fort Bend | 489 |
Federal Commercial-Truck Data
The Federal Motor Carrier Safety Administration (FMCSA) maintains a separate crash-statistics database through its Motor Carrier Management Information System (MCMIS). The figures in this report come from TxDOT, not FMCSA, and the two datasets are not interchangeable.
- •The Federal Motor Carrier Safety Administration maintains a separate crash-statistics database through its Motor Carrier Management Information System (MCMIS).
- •TxDOT and FMCSA datasets are not interchangeable. Different inclusion and reporting rules may cause the totals to differ.
- •FMCSA expressly states that recent MCMIS crash data are preliminary.
- •FMCSA states its MCMIS data are considered preliminary for 22 months to allow changes as additional data are reported.
- •For these reasons, TxDOT 2025 completed annual Texas statistics are the primary numbers used in this report. FMCSA should be treated as supplemental federal context.
This report does not mix an FMCSA total with a TxDOT total in the same chart. TxDOT and FMCSA datasets are labeled independently wherever they appear.
Why Commercial Truck Claims Can Be Different
Commercial truck crashes can involve issues not always present in ordinary passenger-vehicle crashes. The following factors may be relevant in a commercial-trucking claim. This is informational, not a legal promise or guarantee of any outcome.
- •Commercial insurance policies that are typically larger than passenger-vehicle coverage
- •Employer and motor-carrier involvement beyond the individual driver
- •Multiple potentially responsible parties — driver, carrier, shipper, broker, loader, maintenance contractor, or parts manufacturer
- •Driver qualification records, including employment history, driving record, and drug-test results
- •Hours-of-service information and electronic logging-device (ELD) data
- •Vehicle maintenance and inspection records
- •Onboard and electronic data, including black-box / event data recorder (EDR) information
- •Dash-camera or surveillance evidence
- •Cargo and loading issues, where relevant
- •FMCSA compliance issues, where relevant
A violation of a federal or state regulation does not automatically establish liability, and commercial-truck claims do not guarantee larger settlements. Every case depends on its specific facts, evidence, and applicable law.
What These Statistics Do Not Tell You
Crash statistics cannot determine what an individual personal-injury claim is worth.
Claim value can vary based on:
- •Liability — who was at fault and whether fault is clear or disputed
- •Injury severity — the specific type and seriousness of your injuries
- •Medical treatment — the scope and continuity of your treatment
- •Duration and recovery — how long treatment lasted and whether you have recovered
- •Past economic losses — medical bills and lost wages
- •Future damages — future medical needs or earning-capacity impact, where supported by evidence
- •Insurance availability — the coverage that is actually available to compensate you
- •Multiple responsible parties — whether more than one party or company may be liable
- •Evidence — the strength of the documentation supporting your claim
- •Jurisdiction — the county and court where your claim would be filed
- •Other case-specific facts that no dataset can capture
This report does not publish an "average Texas 18-wheeler settlement" or median settlement numbers. Government crash statistics do not establish settlement value. For a personalized preliminary claim range based on the facts of your case, use the free calculator linked below.
For newsrooms and publications
Quotable Findings
These concise findings may be quoted with the attribution shown below and a link to this report.
“Texas CMV crash fatalities declined 13.2% in 2025, but suspected serious-injury crashes remained essentially flat.”
Texas Settlement Calculator analysis of TxDOT 2024 and 2025 CMV county reports.
“The state's four highest-count counties - Harris, Dallas, Bexar and Tarrant - represented roughly 37.5% of all reported Texas CMV crashes in 2025.”
Texas Settlement Calculator analysis of TxDOT 2024 and 2025 CMV county reports.
“Texas recorded fewer total CMV crashes and fatalities in 2025 than in 2024, while suspected serious injuries increased slightly.”
Texas Settlement Calculator analysis of TxDOT 2024 and 2025 CMV county reports.
“Harris County recorded 5,913 CMV-involved crashes in 2025, the highest raw county count in Texas.”
Texas Settlement Calculator analysis of TxDOT 2024 and 2025 CMV county reports.
Embed This Chart
Publishers may embed this chart with the included attribution and link. Do not alter the chart in a way that changes its meaning.
<a href="https://texassettlementcalculator.com/research/texas-18-wheeler-crash-statistics"><img src="https://texassettlementcalculator.com/texas-cmv-fatalities-2021-2025.svg" alt="Texas CMV crash fatalities, 2021-2025" width="1200" height="675"></a><p>Source: TxDOT. Chart by <a href="https://texassettlementcalculator.com/research/texas-18-wheeler-crash-statistics">Texas Settlement Calculator</a>.</p>Were You Injured in a Texas Commercial-Truck Crash?
Commercial-truck claims may involve factors that ordinary car-accident estimates do not address, including commercial insurance, motor-carrier responsibility, multiple potentially responsible companies, electronic logging records, maintenance and inspection evidence, serious injuries, future treatment, and Texas venue considerations.
The commercial calculator evaluates the factors you report and provides a free preliminary claim range. It does not provide legal advice or guarantee any result.
Estimate My Texas Truck Accident ClaimAbout 2 minutes. No obligation. See your preliminary range before deciding whether to request an attorney connection.
Citing This Research
Journalists, researchers and organizations may cite the statistics and analysis on this page with attribution to Texas Settlement Calculator and the underlying government source.
Suggested citation: Texas Settlement Calculator, 2026 Texas 18-Wheeler Crash Data Report, https://texassettlementcalculator.com/research/texas-18-wheeler-crash-statistics
Sources and Methodology
Primary source
The TxDOT 2025 report states that its information represents reportable data collected from Texas Peace Officer's Crash Reports (CR-3) received and processed by the Department as of April 7, 2026.
Trend sources
- TxDOT: 2021 Commercial Motor Vehicle (CMV) Involved Crashes and Injuries by County
- TxDOT: 2022 Commercial Motor Vehicle (CMV) Involved Crashes and Injuries by County
- TxDOT: 2023 Commercial Motor Vehicle (CMV) Involved Crashes and Injuries by County
- TxDOT: 2024 Commercial Motor Vehicle (CMV) Involved Crashes and Injuries by County
- TxDOT: 2025 Commercial Motor Vehicle (CMV) Involved Crashes and Injuries by County
Supplemental federal source
Checked October 1, 2026. FMCSA displayed an MCMIS snapshot date of August 28, 2026 and stated that calendar-year 2025 crash data were still being reported. FMCSA also states that recent MCMIS crash data are preliminary and subject to change.
Calculation method
Texas Settlement Calculator transcribed statewide totals and selected county values from the cited TxDOT tables. County rankings sort raw 2025 crash totals in descending order. Year-over-year percentage change equals (2025 value minus 2024 value) divided by the 2024 value, multiplied by 100 and rounded to one decimal place. The four-county concentration divides the combined Harris, Dallas, Bexar, and Tarrant counts by the statewide 2025 total.
Limitations
Raw crash counts do not measure relative danger and are not adjusted for population, commercial traffic, vehicle miles traveled, or roadway exposure. TxDOT may revise prior-year values. Five annual observations do not establish causation, and crash statistics cannot determine the value of an individual legal claim.
Texas research network
Explore statewide and regional crash-data research
Browse the full TSC research index for commercial-vehicle, DWI, regional and corridor reports built from cited public data.
Open the Research CenterRelated Texas Trucking Resources
Download the Research Data
The statewide trend and county-level data used in this report are available as a downloadable CSV file for researchers, journalists, and the public. The file documents the publisher, underlying TxDOT source, relevant data years, and compilation date.
Download CSV (texas-cmv-crash-data-2026-report.csv)Research Transparency
Texas Settlement Calculator compiled and analyzed publicly available Texas crash statistics for this report. The underlying crash statistics are attributed to the Texas Department of Transportation (TxDOT). Any calculated percentages, rankings, or comparisons produced by Texas Settlement Calculator are identified as such on this page. This report may be updated when authoritative source data changes.
Research & Data Analysis: Texas Settlement Calculator
Corrections
If you identify a potential error in this report or its underlying calculations, please contact Texas Settlement Calculator so the data can be reviewed against the cited TxDOT source.
Research compiled by Texas Settlement Calculator from publicly available government crash statistics.
TexasSettlementCalculator.com is an independent informational and advertising platform. It is not a law firm and does not provide legal advice.
Independent-publication disclosure: This independent report is not affiliated with, sponsored by, approved by, or endorsed by the Texas Department of Transportation, the Federal Motor Carrier Safety Administration, or any other governmental agency. TxDOT and FMCSA are identified solely as sources of underlying public data.
This tool produces a preliminary, non-binding estimate based on the information you provide and general personal-injury valuation methods. It is not legal advice, not a guarantee of any outcome, and not a substitute for review by a licensed attorney. Actual settlements and verdicts vary widely based on evidence, jurisdiction, insurance coverage, and many other factors. Texas Settlement Calculator is not a law firm and does not practice law; use of this tool does not create an attorney-client relationship.